


What does a container return scheme mean for litter in the environment?
On 13 March, the government announced its proposal to overhaul current recycling and waste management. It proposes to standardise recycling across Aotearoa, food waste collections for business, and a container return scheme.
Sustainable Coastlines CEO, Josh Borthwick, thinks that the container return scheme is a positive move, but that more can be done to reduce litter in our environment.
“The container deposit scheme has been a long time coming! It’s a huge win in incentivising people to keep plastic, aluminium and glass out of our landfills, and ultimately our moana. It gets us another step closer to a circular economy, where products are produced and reproduced with a view to managing their entire lifecycle, rather than the waste-based economy we find ourselves in today.
So this is a step in the right direction, but at Sustainable Coastlines we still see recycling as a last resort — we envision a future where single-use is a thing of the past.”
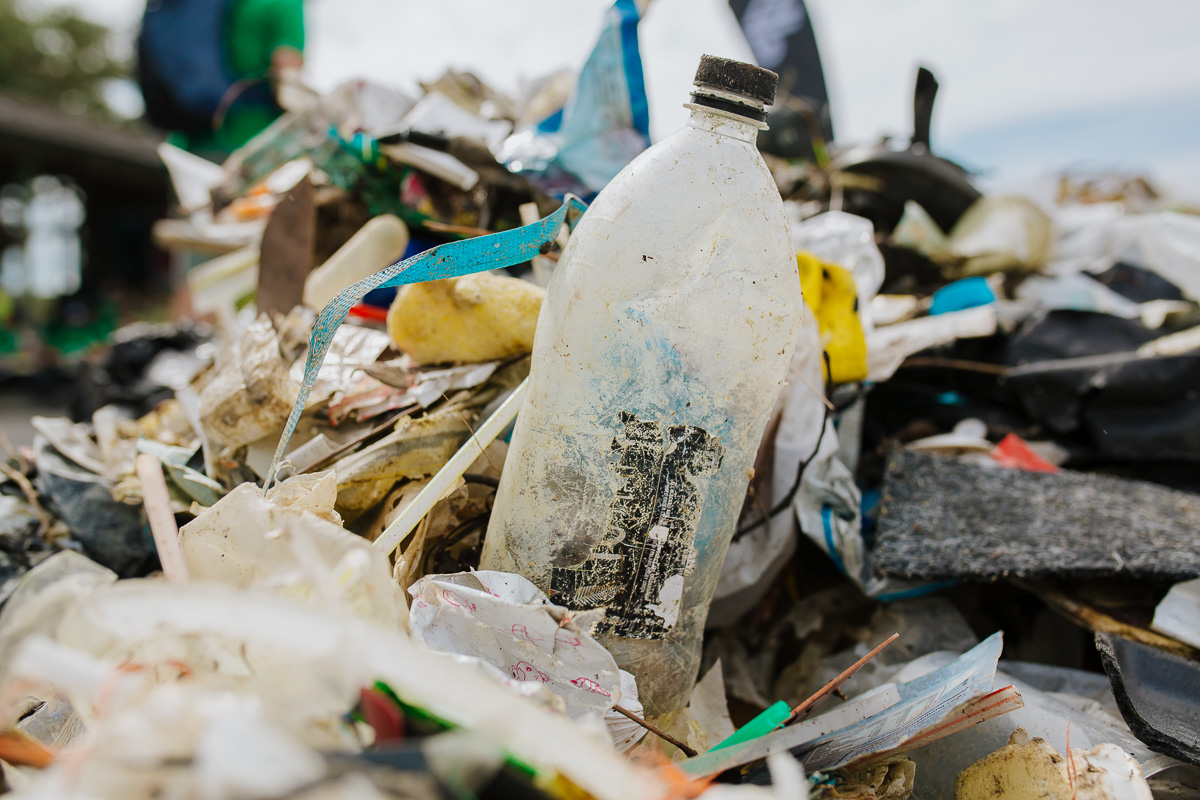
What kind of impact might the government’s proposed container deposit scheme have on the litter that we find on our clean-ups? We crunched some numbers on the Litter Intelligence insights page, and found that 7.68% of litter items our volunteers find on beach surveys relate to the items proposed in the deposit scheme. That percentage comprises more than 20,000 pieces of single-use rubbish related to drinks.
")